
Sheetsu
Turn a Google Spreadsheet into a REST API. Use it as a data store. Without setup.

a curated guide to the best tools, resources and technologies for data visualization
Turn a Google Spreadsheet into a REST API. Use it as a data store. Without setup.

Sheetgo is a Google Sheets add-on that helps to connect, centralize, consolidate, import or distribute spreadsheet data. Sheetgo enables users to establish a live connection from any Google Sheets, Excel files and CSV files to your Google Sheets.
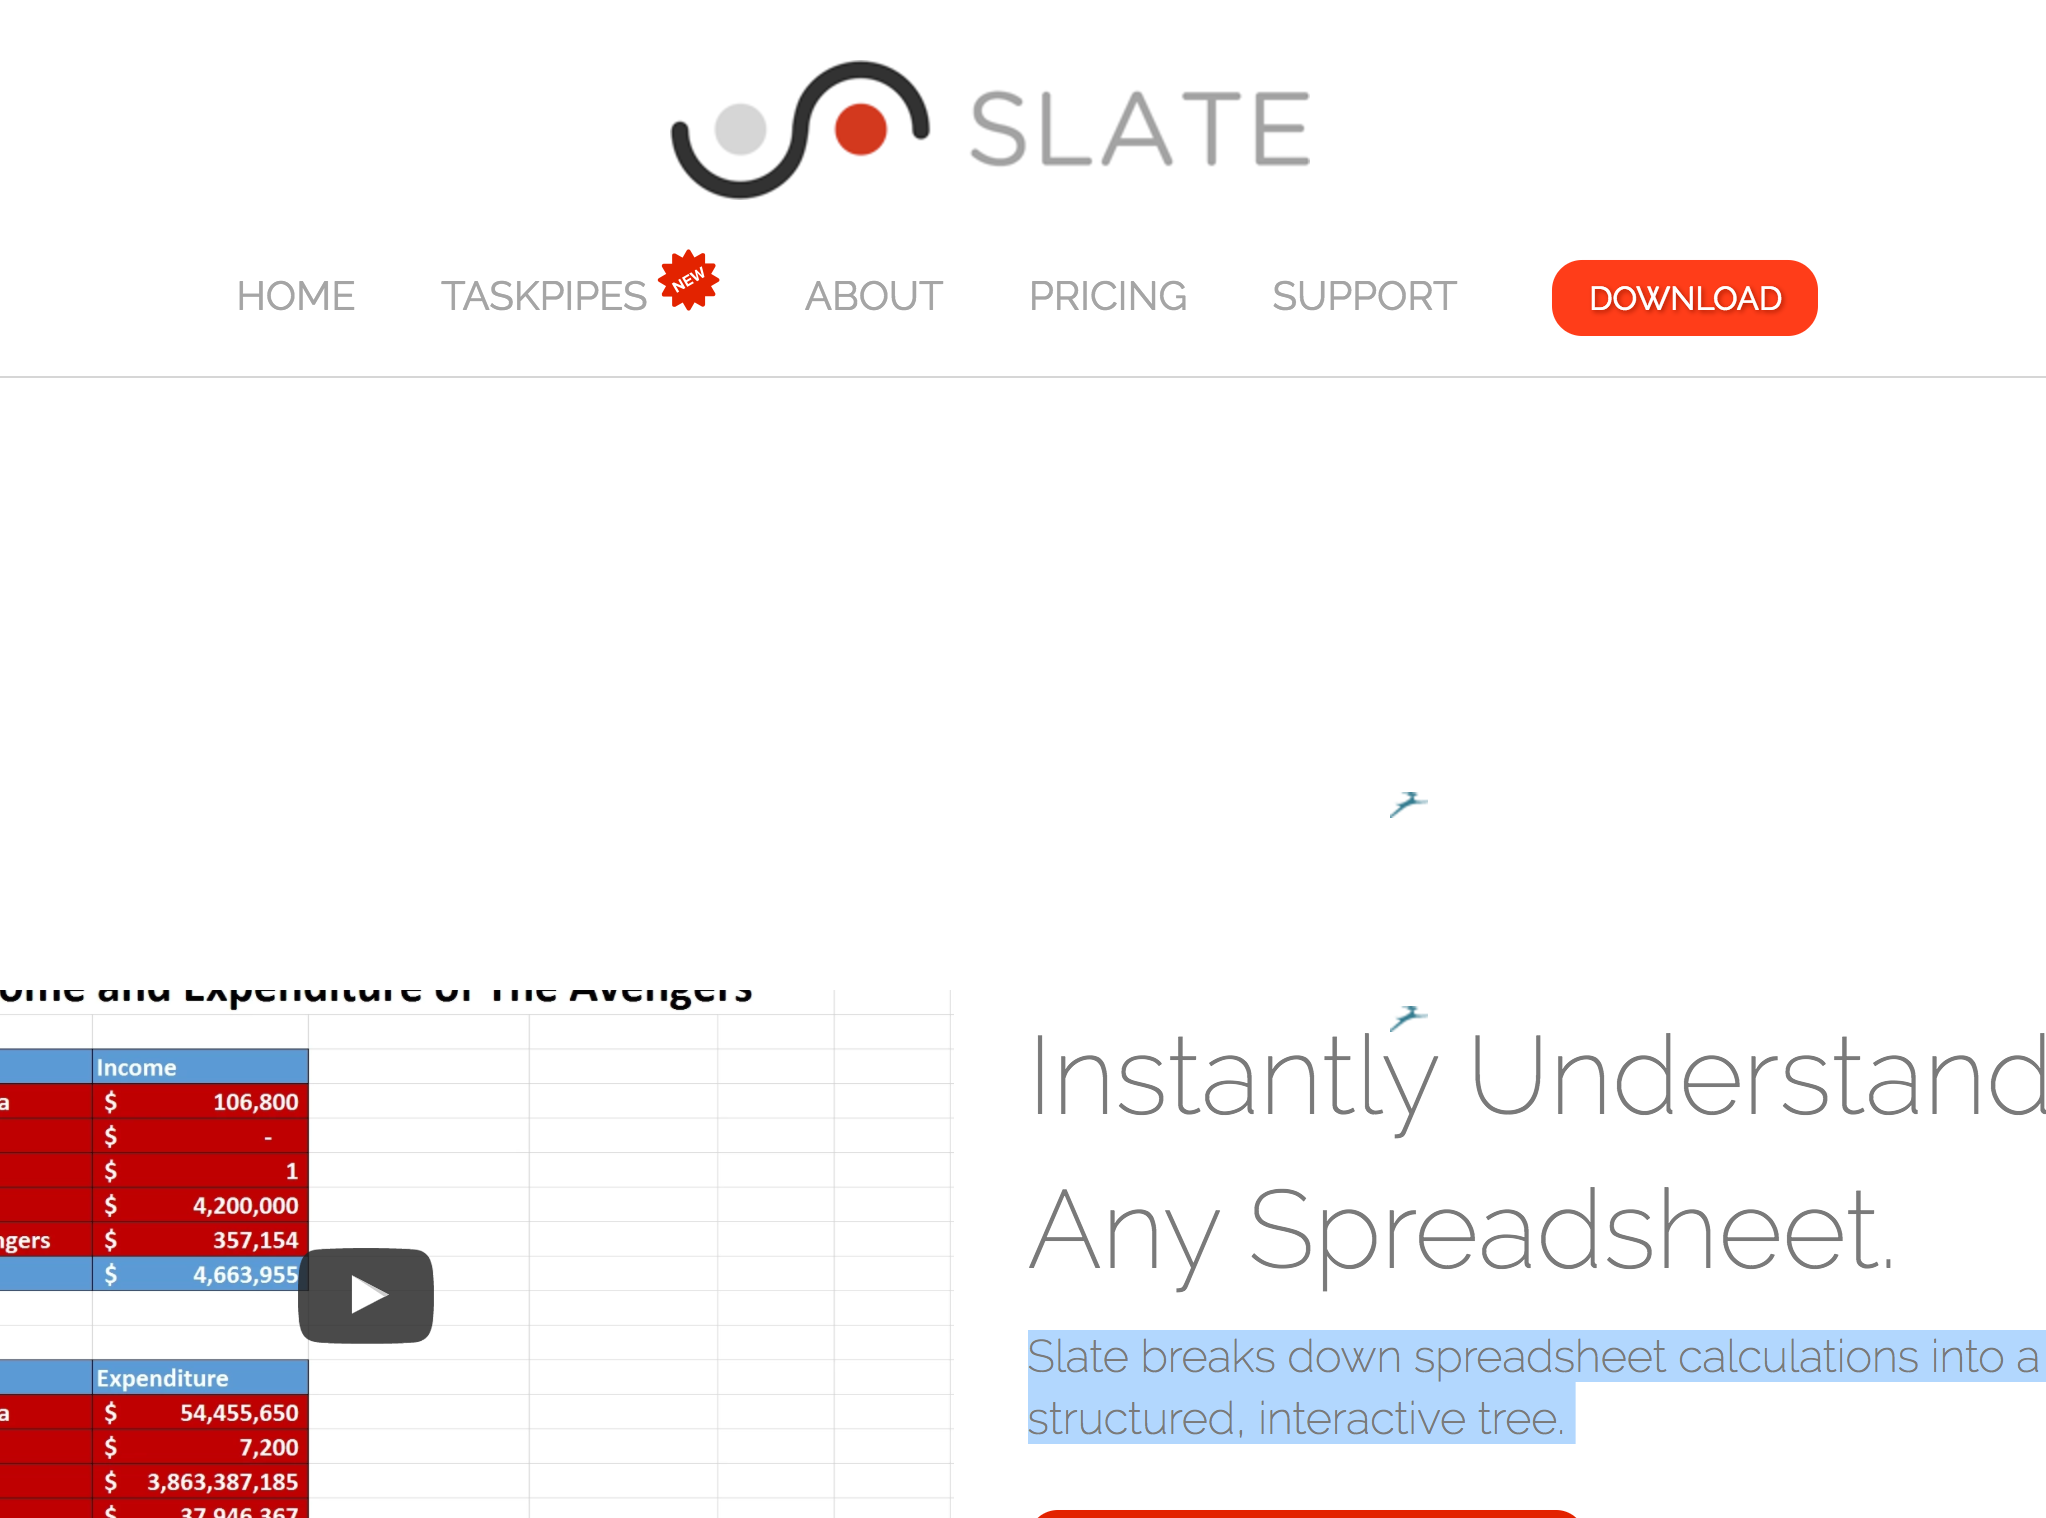
Slate is an Excel plugin that breaks down spreadsheet calculations into a structured, interactive tree.
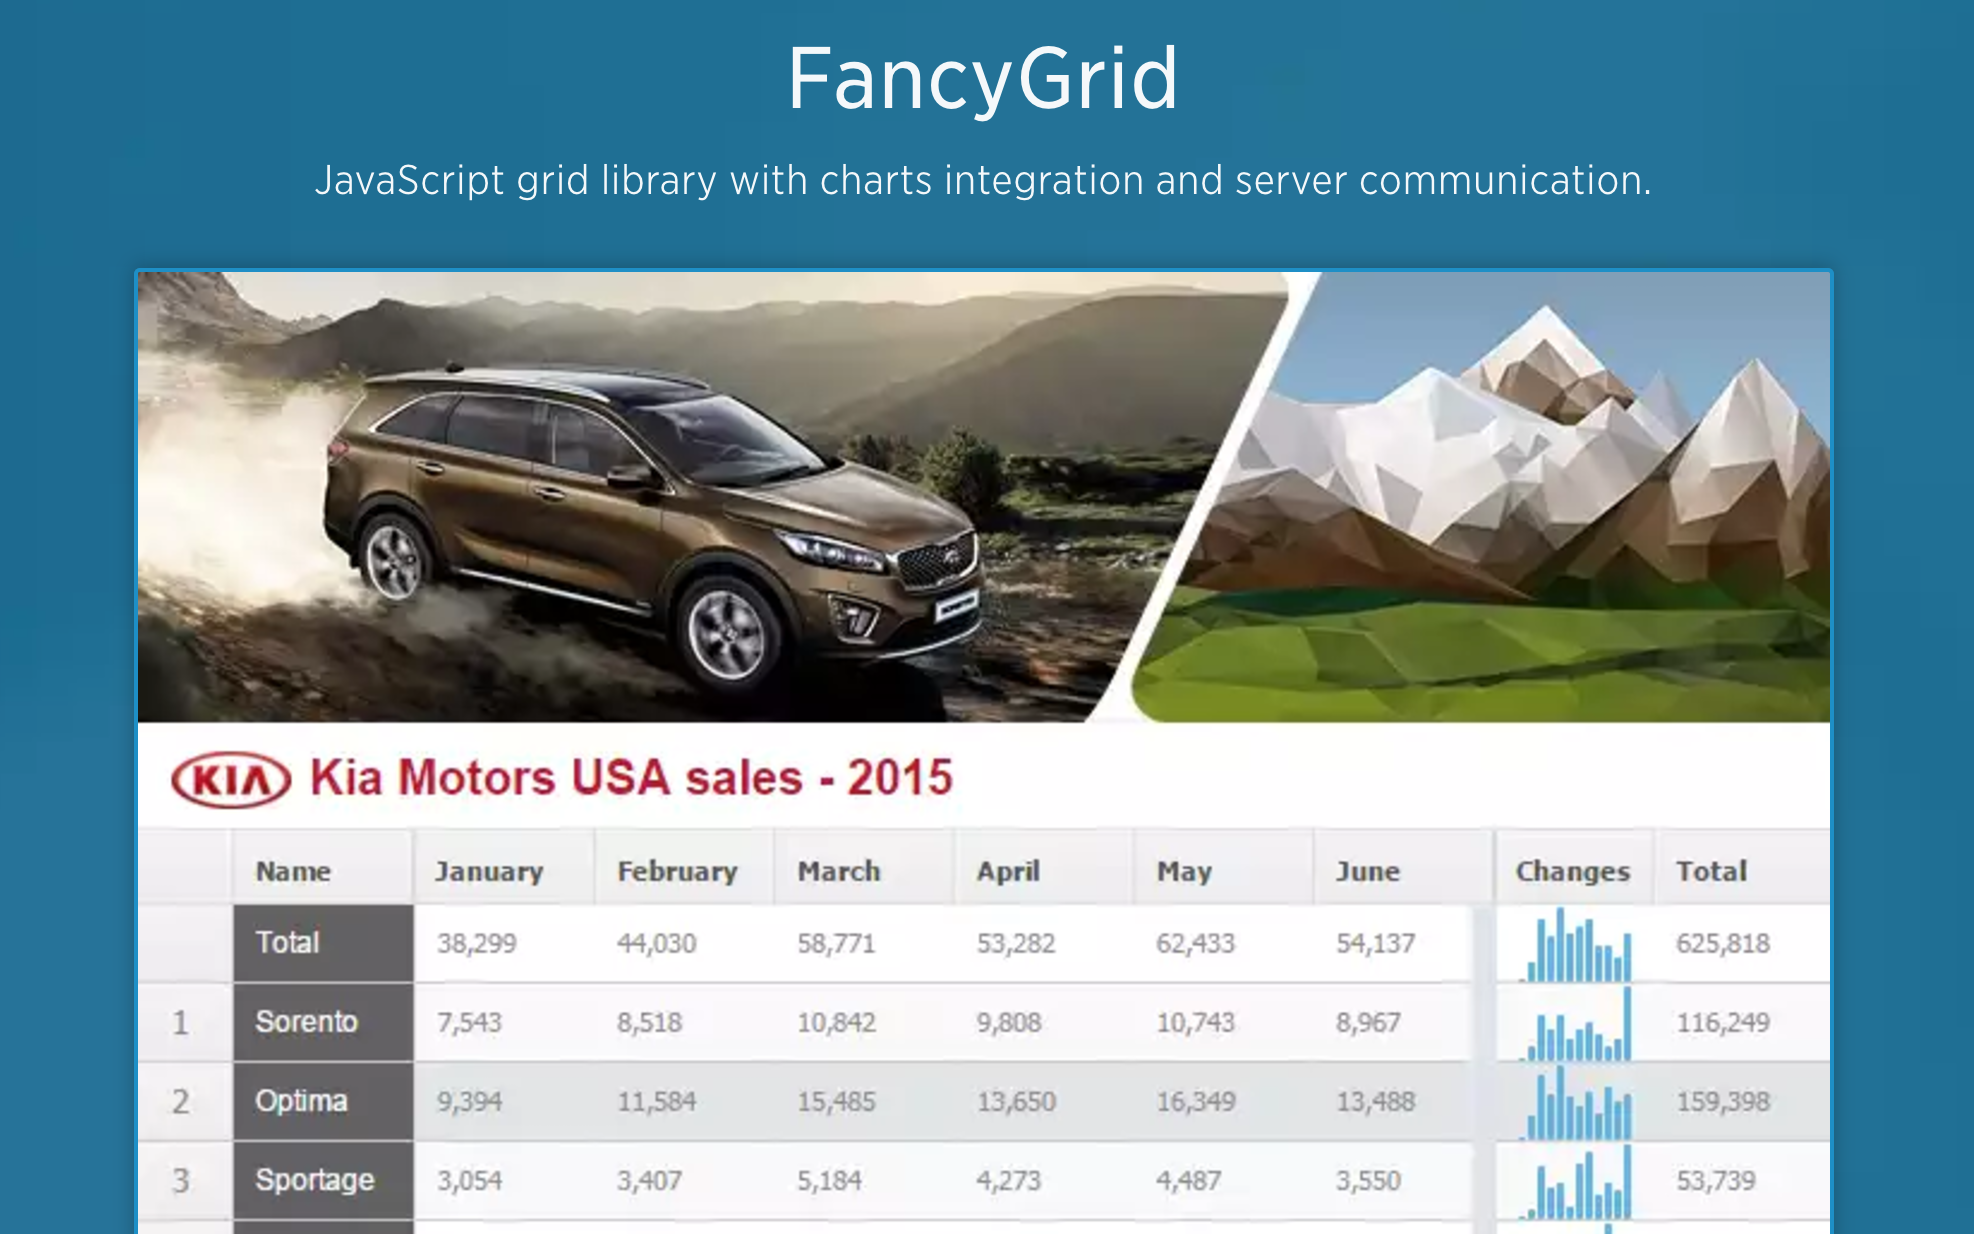
JavaScript grid library with charts integration and server communication.

Build and share spreadsheet-powered apps, visualizations, tables and more all from Google Sheets.
A free Google Sheets add-on that allows you to turn your spreadsheets into a wide variety of searchable, filterable, visual, interactive and geographic web apps.
Analyse-it brings powerful statistical analysis and data visualisation into Microsoft Excel. All the statistical analysis you need, in an application you already know.
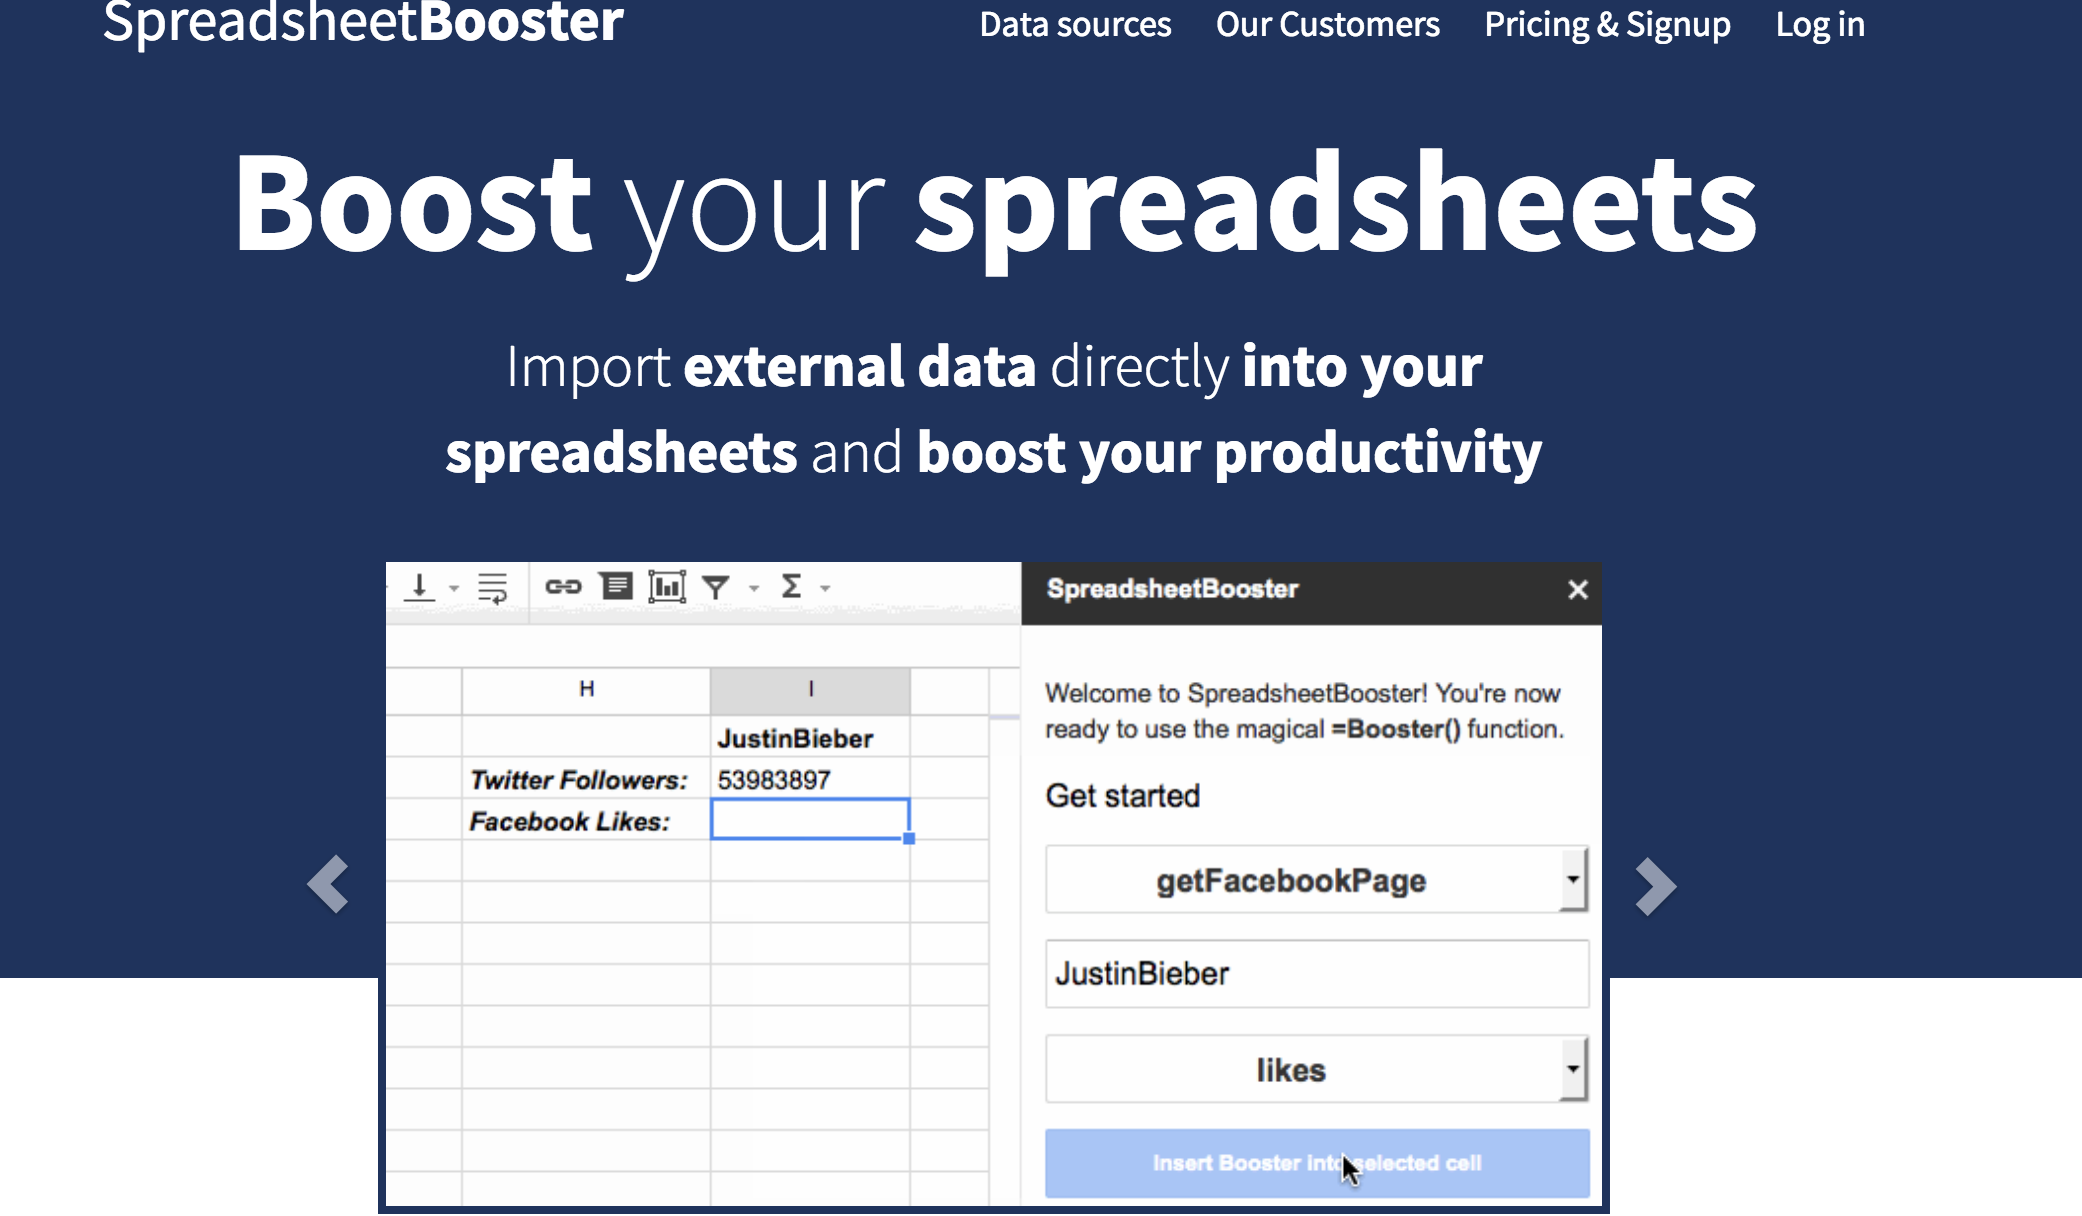
Painlessly import data from a variety sources into Google Sheets. No more copying-and-pasting.
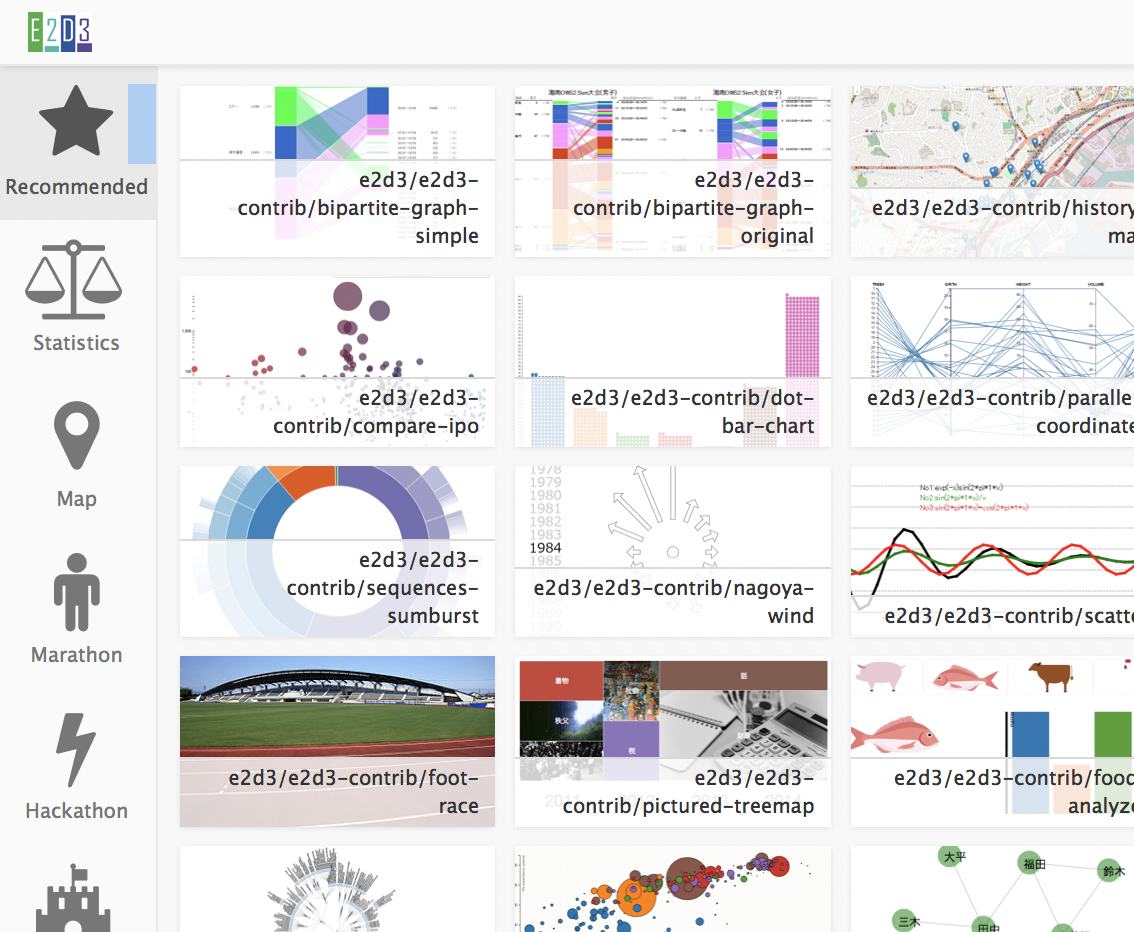
Excel add-in that allows rapid creation of interactive d3.js graphics.
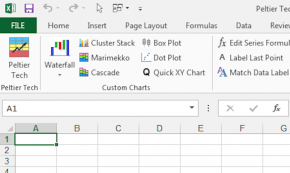
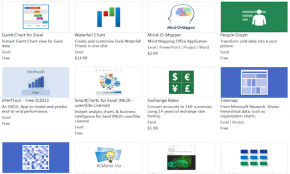
Jon Peltier’s Tech Chart Utility provides custom chart types and formatting tools for Microsoft Excel. It works in Excel for Windows versions 2007, 2010, and 2013 (32-bit and 64-bit and now also in Excel 2011 for Macintosh. It is integrated into Microsoft Excel spreadsheet software as a standard add-in allowing you to create complex charts in a few simple steps using intuitive dialog without the need for programming or formula skills. It is easy to install, and the utility adds a custom tab to the Excel Ribbon. You can customize the finished charts with your own colors, fonts, and other formatting and easily access all the provided functionality from your own VBA programs.
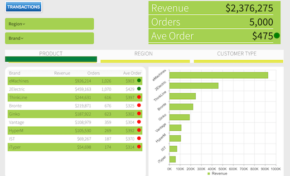
Creating interactive dashboards in Excel® can be tedious, difficult, time-consuming and requires advanced product knowledge to get it right. DecisionPoint™ offers a much faster, easier way of creating stunning interactive dashboards against Excel® data.
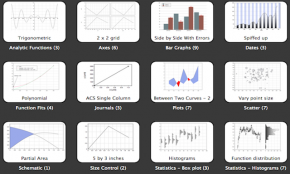
DataGraph is a simple and powerful graphing application for Mac OS X. It is a great companion for Excel, Numbers or any of the big statistical packages. Simple because it is very easy to draw plots, bar graphs, and fit functions. Start typing in data and the graph immediately shows up. Pick from the initial template list and modify the data, change colors, resize easily and interactively. n Examples/references: Screenshots
Microsoft’s Office Apps provides a suite of free and paid-for plugins to extend the functionality of your office products. In particular there are a range of visualisation-related apps that can be explored to add new charting capability to Excel.