
D3-ID3
ID3 is an Integrated Development Environment for Data-Driven-Documents (D3). ID3 provides developers, data scientists, journalists and more, with the ability to harness the power of D3.js, and with ease.

a curated guide to the best tools, resources and technologies for data visualization
ID3 is an Integrated Development Environment for Data-Driven-Documents (D3). ID3 provides developers, data scientists, journalists and more, with the ability to harness the power of D3.js, and with ease.
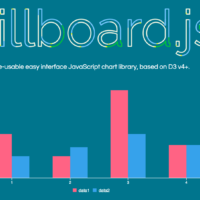
Re-usable easy interface JavaScript charting library, based on d3.js V4.

Made by Eventbrite, Britecharts is a client-side reusable Charting Library based on D3.js v4 that allows easy and intuitive use of charts and components that can be composed together creating amazing visualizations. Uses ES2015.
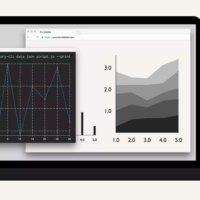
Robust, flexible and native React.js components for
modular charting and data visualization.
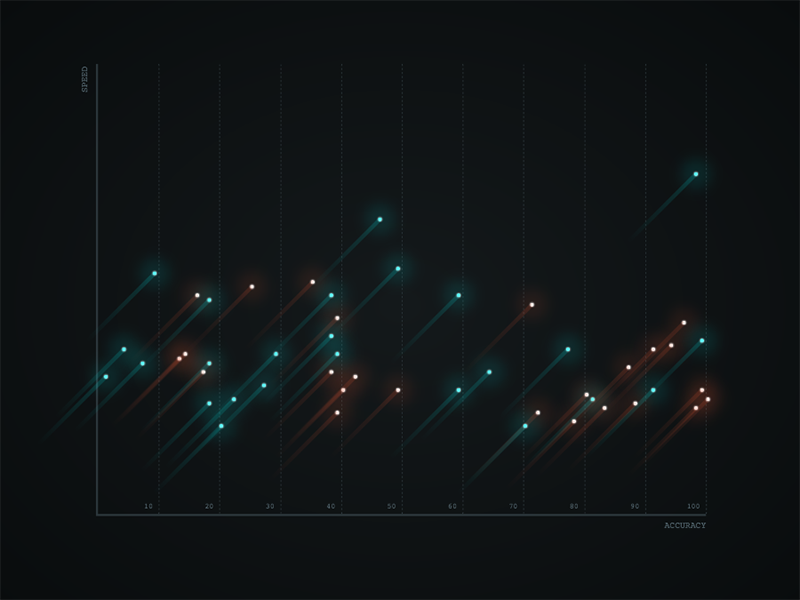
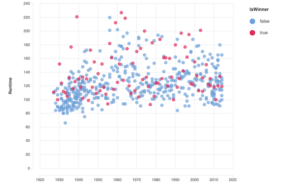
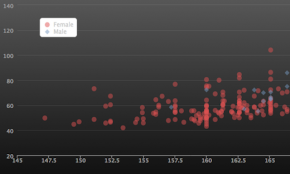
Responsive CSS scatter plot chart. Simple JQuery, HTML, SASS scatter plot view. Easy to customize. (Contributed by: Jesse Korzan)

AnyChart is a flexible, feature-packed JavaScript (HTML5) based charting library that is free for open-source use (with licensing fees for commercial use). It features a wide variety of multivariate charts to kickstart development of dashboards and data viz projects. Like d3.js, AnyChart binds data to serialized vector graphics (SVGs) and uses JavaScript to create responsive, interactive visualizations without needing to learn d3 syntax.
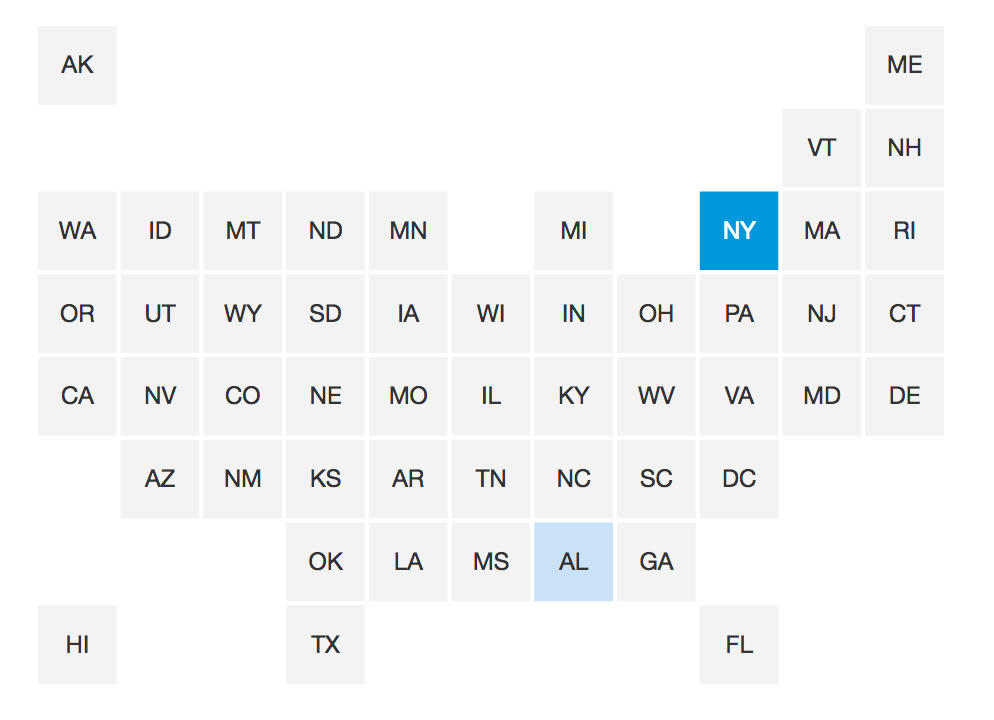
Square bin map library from The Wall Street Journal
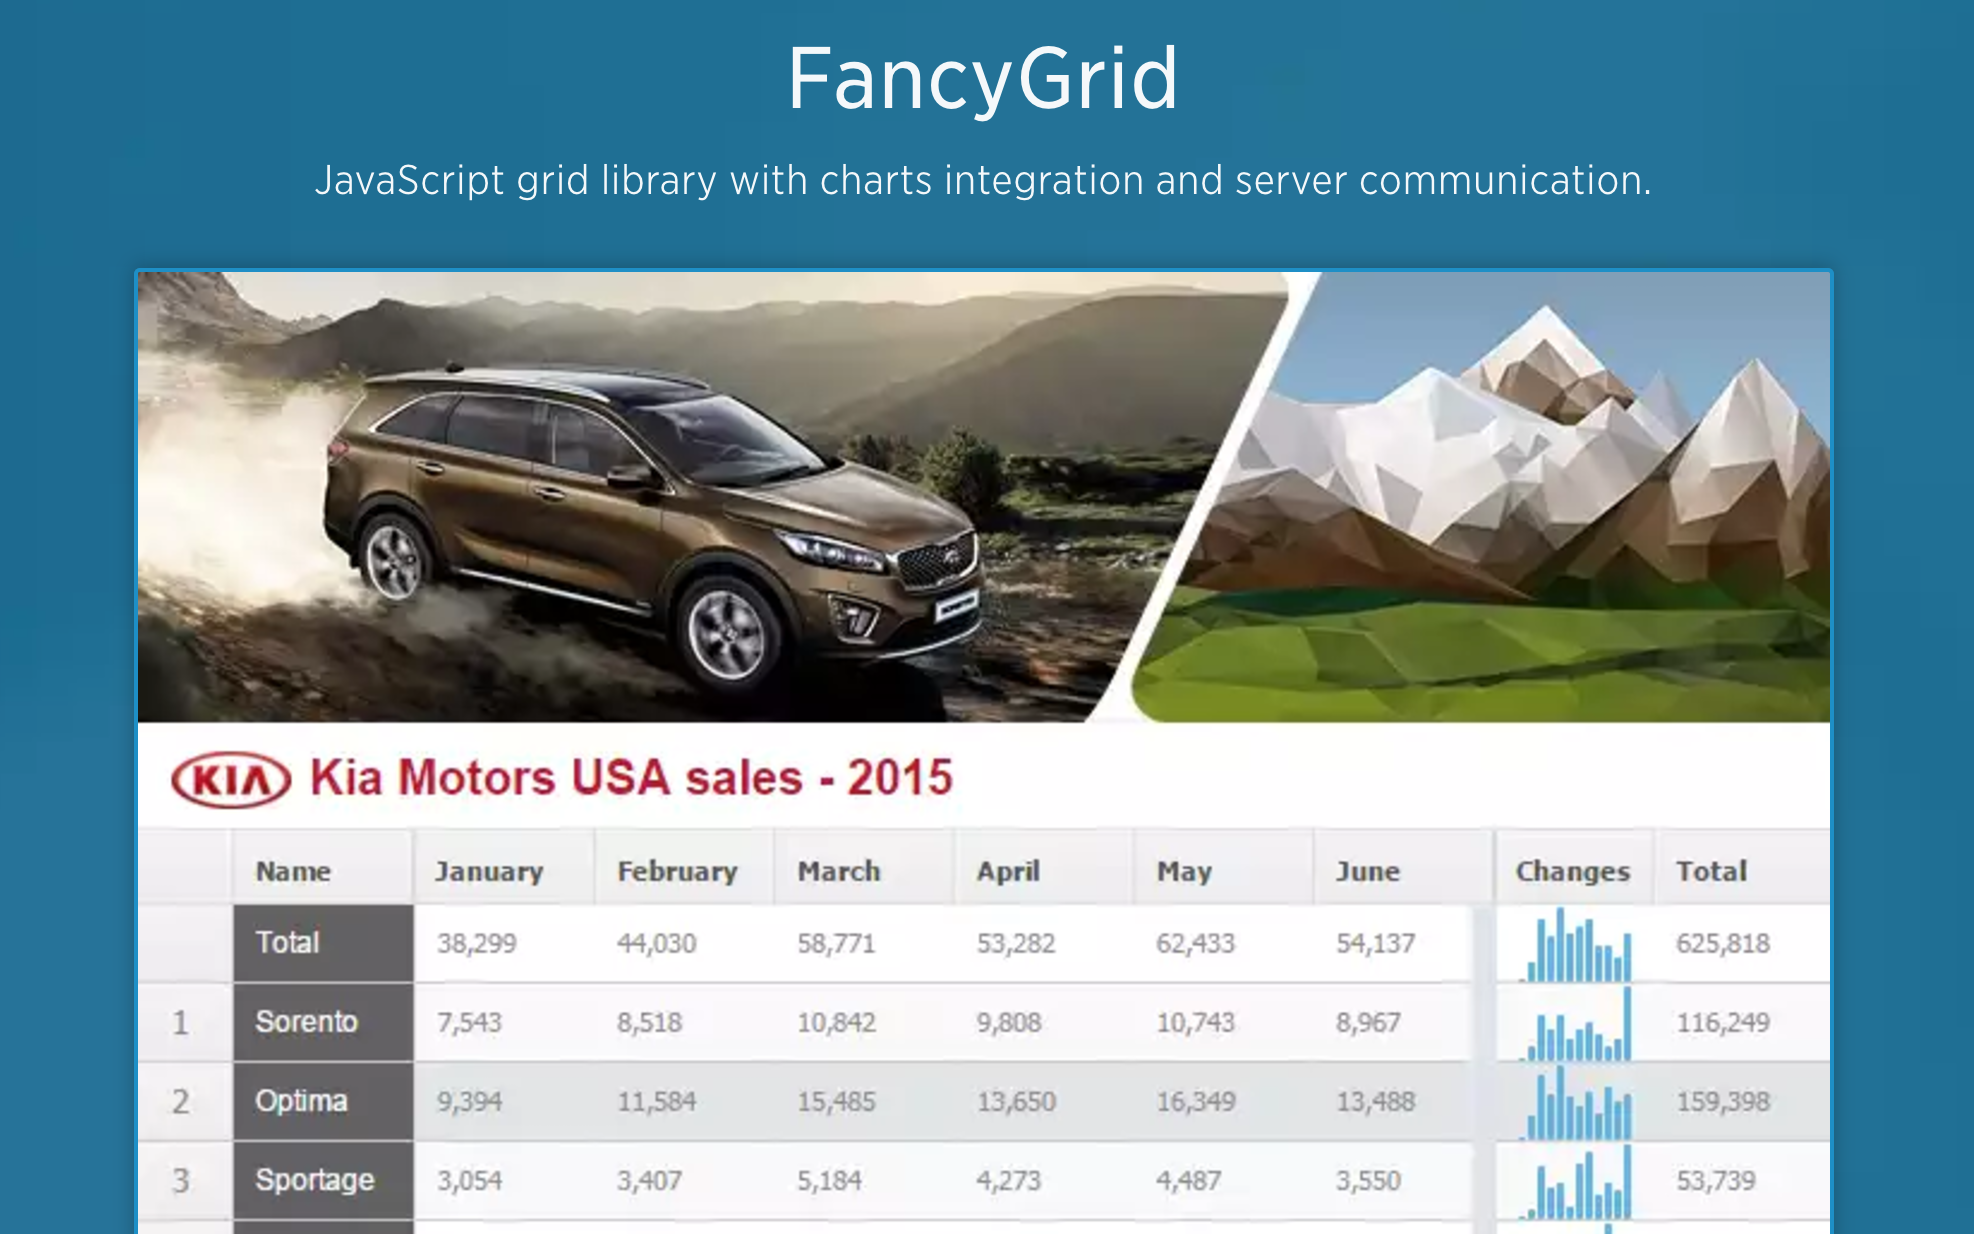
JavaScript grid library with charts integration and server communication.
A suite of modular libraries and tools which work together or independently to enable rich interactive content on open web technologies via HTML5.
Build interactive HTML5 charts using ZingChart JavaScript charting library and feature-rich API set. Render them in any browser and on any device. Export them quickly and easily.
Gorgeous and streamlined D3-based reusable charting library.
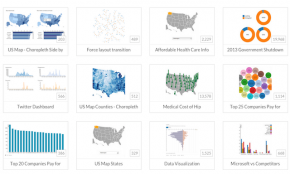
Crossfilter is a JavaScript library for exploring large multivariate datasets in the browser.
Vida.io offers an easy way to build reusable cloud visualizations: Clone visualization templates, customize without coding skills and embed/share in the cloud.
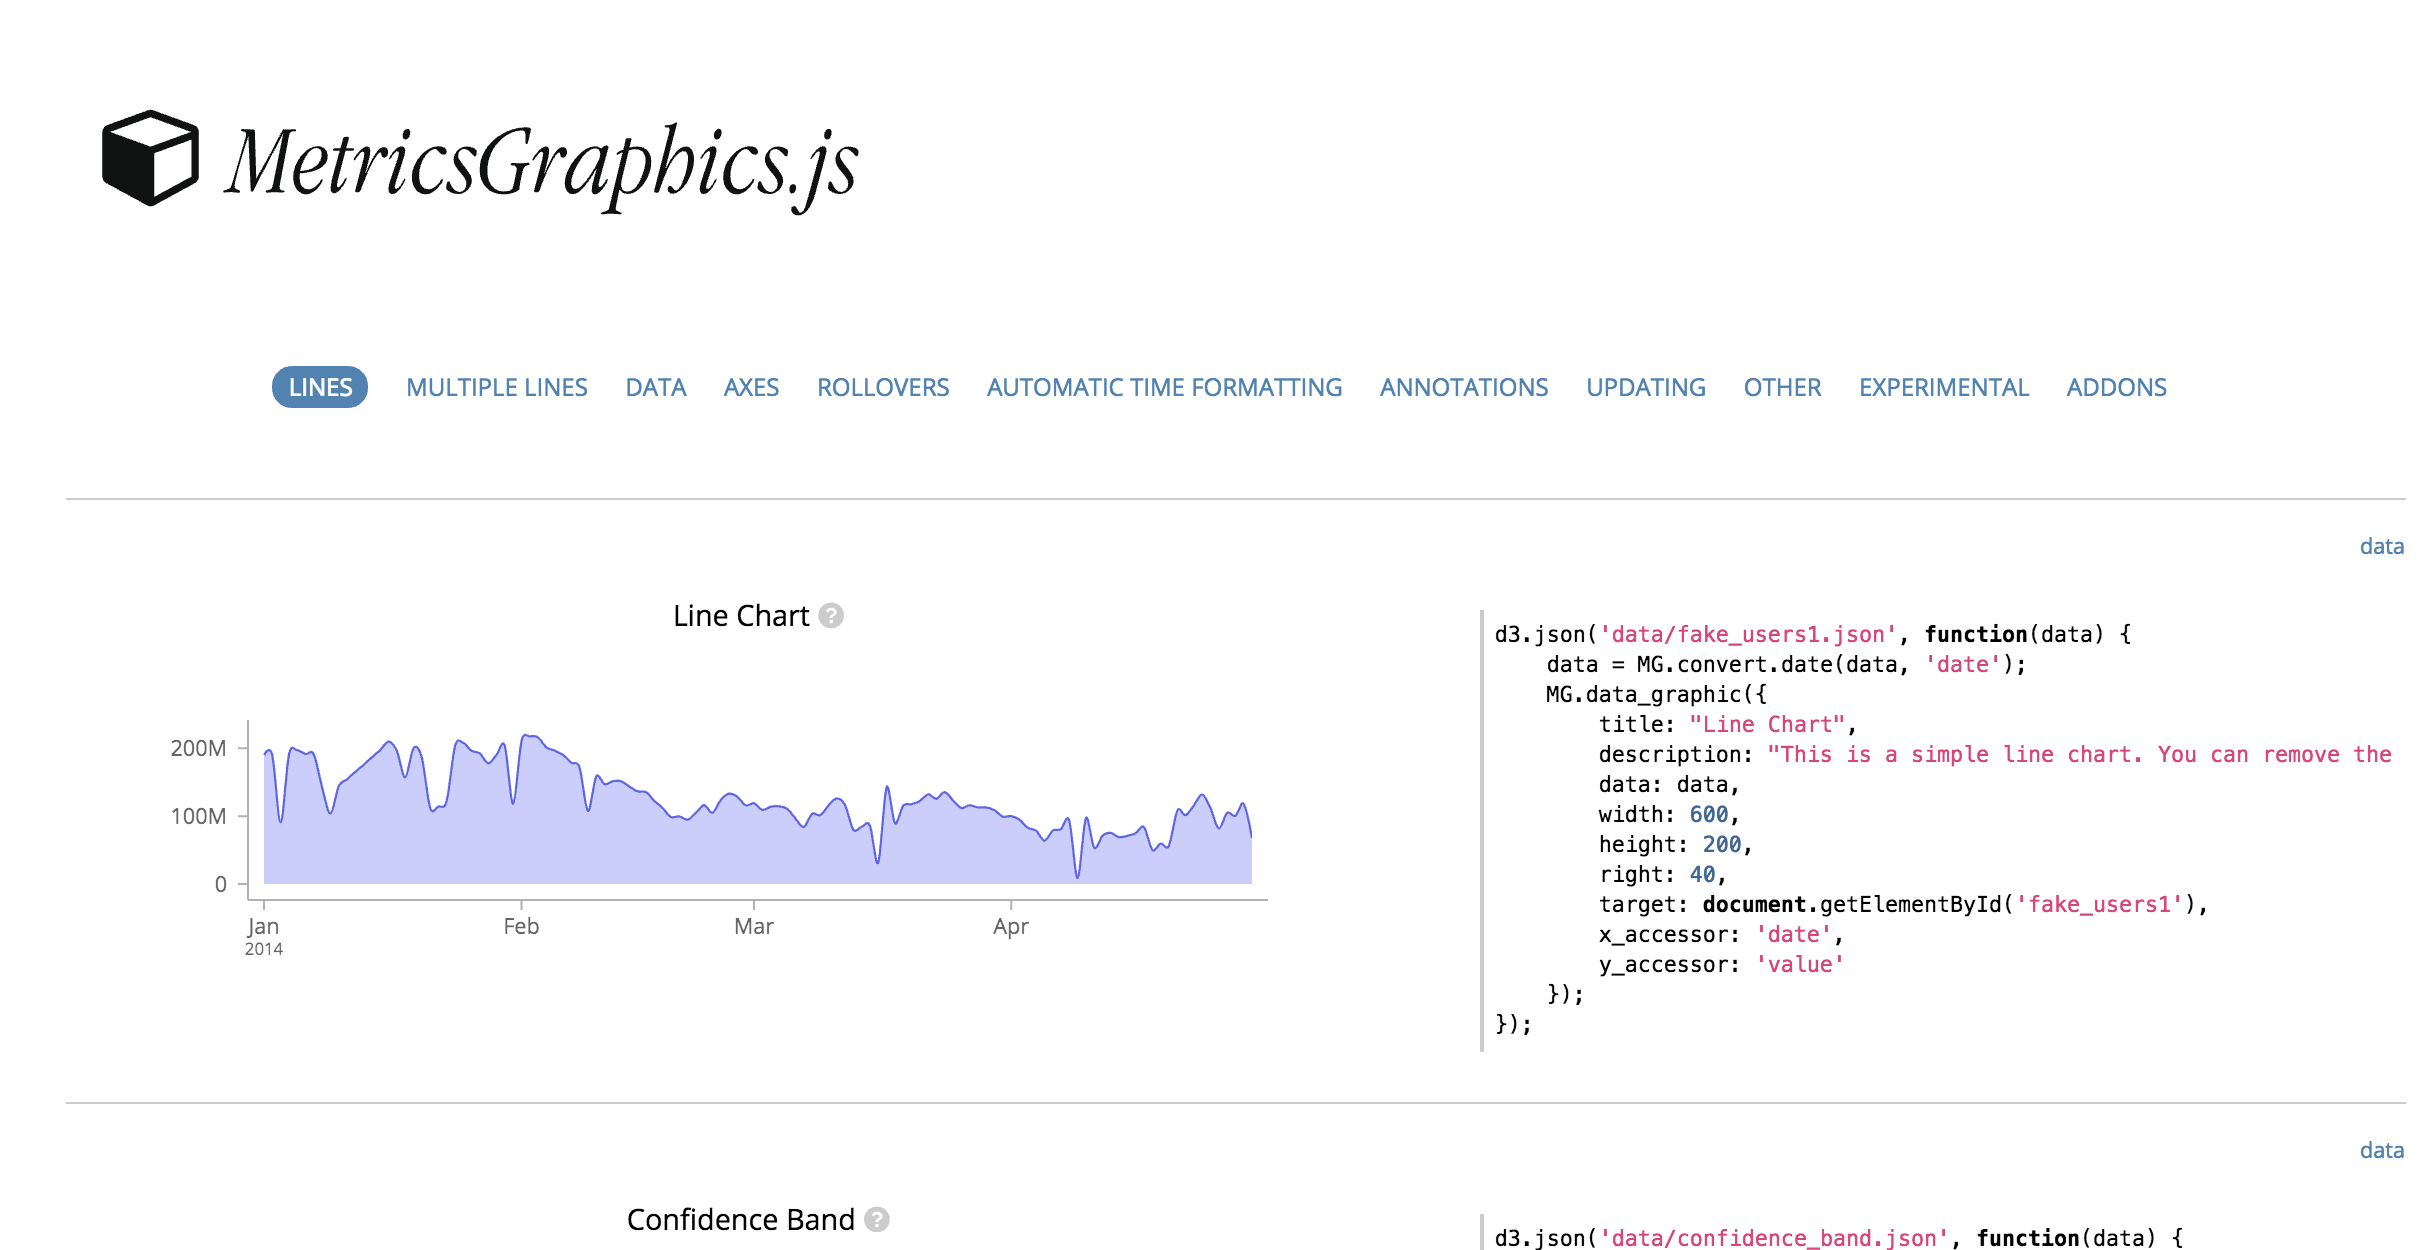
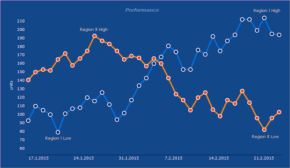
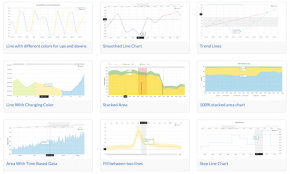
MetricsGraphics.js is a library built on top of D3 that is optimized for visualizing and laying out time-series data.
dc.js is a javascript charting library with native crossfilter support and allowing highly efficient exploration on large multi-dimensional dataset
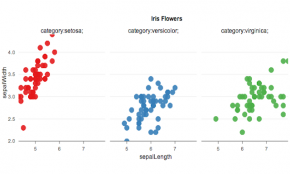
TauCharts is a JavaScript charting library. It is based on the D3 framework and ‘Grammar of Graphics’ concepts. TauCharts has a perfect visual design, it is flexible and powerful, and can be extended with plugins.
Bring your data to life: Chart Component Suite with Maps and Gauges for Developers. Quick and easy chart design. Hugely dynamic and interactive charts. Deliver charts across multiple platforms and devices
Raphaël is a small JavaScript library that should simplify your work with vector graphics on the web.
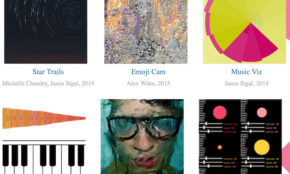
p5.js is a JavaScript library that starts with the original goal of Processing—to make coding accessible for artists, designers, educators, and beginners—and reinterprets this for today’s web.
Polychart.js is an expressive JavaScript graphing library capable of producing a wide array of graphics fairly easily. It takes care of many of the fiddly details that make plotting a hassle (like drawing legends) as well as providing a powerful model of graphics that makes it easy to produce complex multi-layered graphics. Additionally, it has a built-in interaction model that makes it easy to produce charts that interact with the user and with one another.
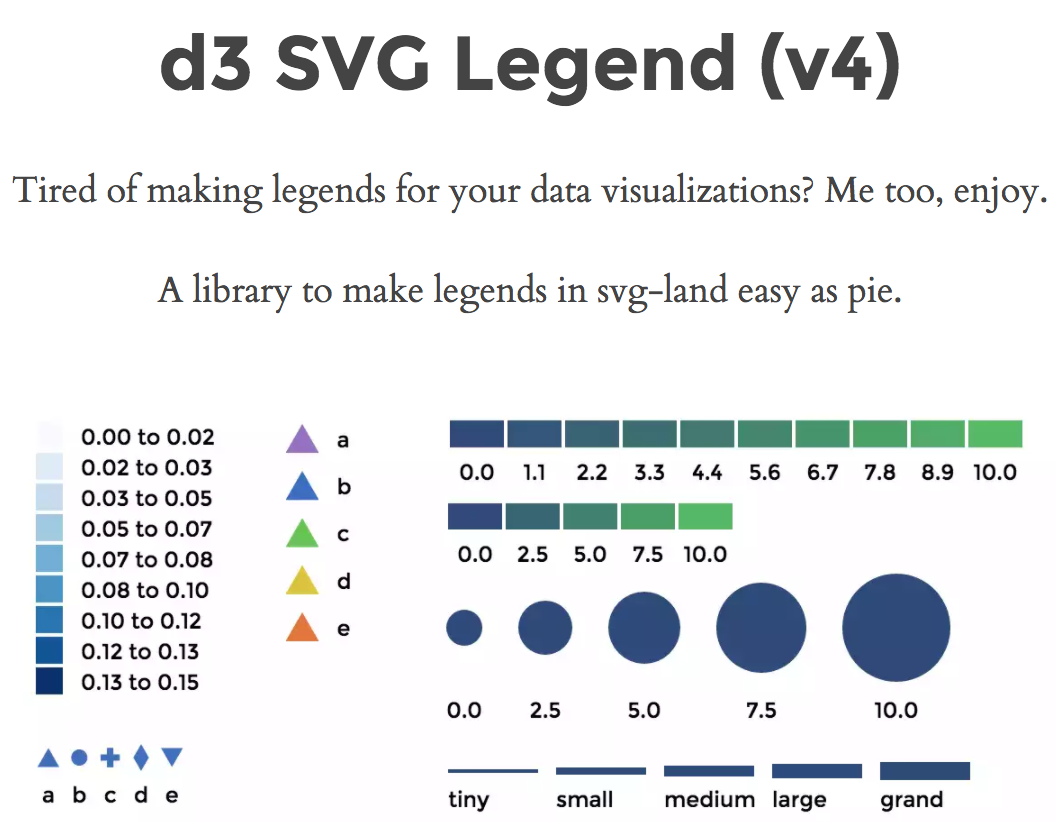
Tired of making legends for your data visualizations? D3 Legend is what you’ve been looking for.
Built on top of D3, Plottable gives you a set of flexible, premade components that you can combine and rearrange to build charts.
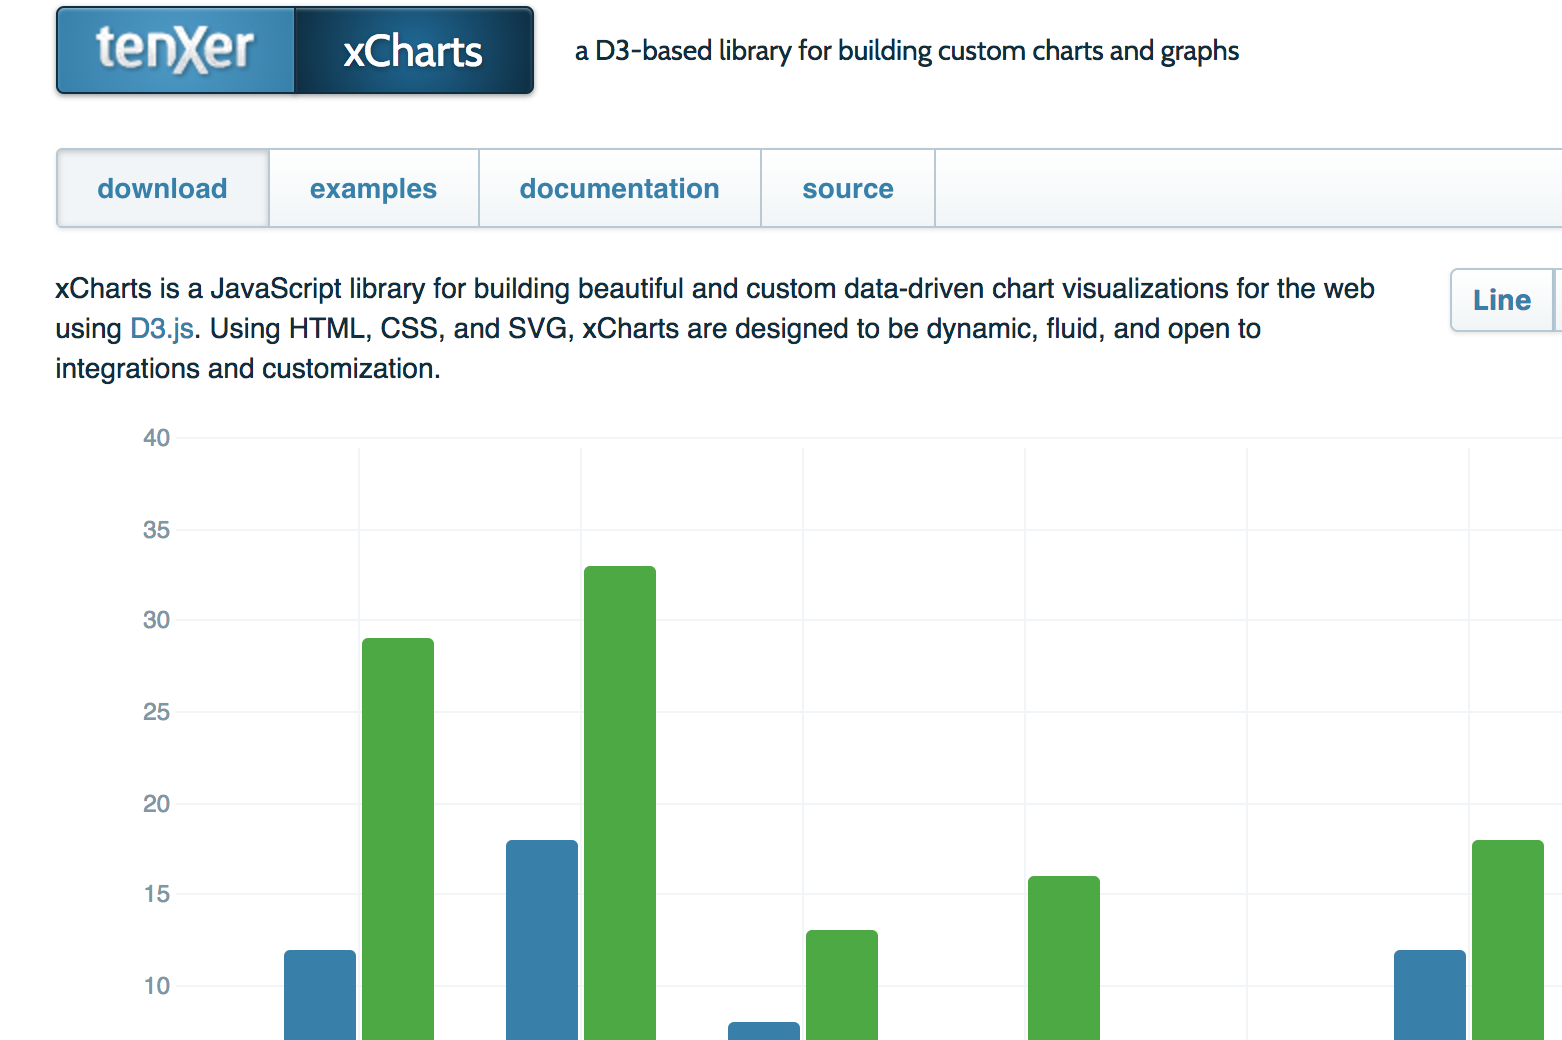
xCharts is a JavaScript library for building beautiful and custom data-driven chart visualizations for the web using D3.js. Using HTML, CSS, and SVG, xCharts are designed to be dynamic, fluid, and open to integrations and customization.
JavaScript & D3 Charts, Maps and Stock Real-Time Graphics
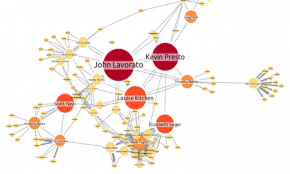
KeyLines is a JavaScript toolkit for visualising networks. It works with any graph database, on all major browsers and on all platforms - including touch devices and smart phones. It uses HTML5 but also works on old versions of Internet Explorer.
FusionCharts is a JavaScript based charting library that offers a huge collection of 90+ charts and 1000+ maps. It is compatible with all browsers, and has a powerful API. It also offers dedicated plugins for working with popular JavaScript libraries and frameworks like jQuery, AngularJS, React etc.
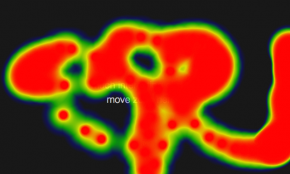
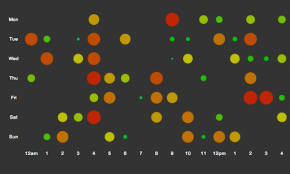
This JavaScript library will help you make your 3 dimensional data speak up. Use heatmap.js v2.0 to add new value to your project, build a business based on it, study and visualize user behaviour, and much more. Whether you want to have an aggregated overview of your users behaviour, or look at thousands of events distributed on a map…
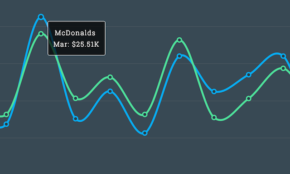
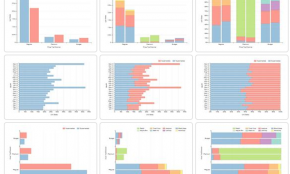
Highcharts is a charting library written in pure HTML5/JavaScript, offering intuitive, interactive charts to your web site or web application. Highcharts currently supports line, spline, area, areaspline, column, bar, pie, scatter, angular gauges, arearange, areasplinerange, columnrange, bubble, box plot, error bars, funnel, waterfall and polar chart types. n Examples/references: Demos
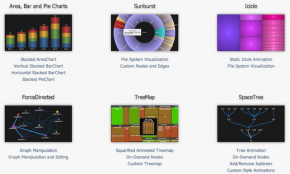
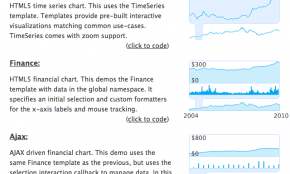
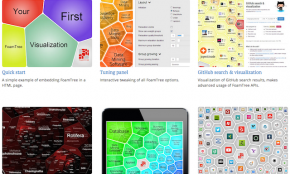
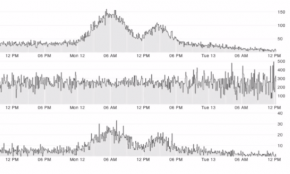
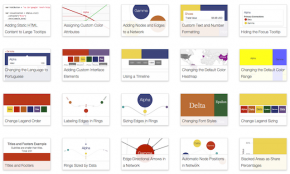
The JavaScript InfoVis Toolkit, created by Nicolas Garcia Belmonte, provides a comprehensive range of tools for creating Interactive Data Visualizations for the Web. n Examples/references: Demos
Forio Contour provides a core set of common visualizations that you can see in the gallery, and it’s easy to extend if you want to add your own customizations. Plus, it’s free and open source. Forio Contour uses the popular D3 engine and adds a set of intuitive abstractions so you can easily create graphs and charts.
The aim of dimple is to open up the power and flexibility of d3 to analysts. It aims to give a gentle learning curve and minimal code to achieve something productive. It also exposes the d3 objects so you can pick them up and run to create some really cool stuff.
Envision.js is a library for creating fast, dynamic and interactive HTML5 visualizations.
FoamTree is a JavaScript tree map visualization with innovative layout algorithms and animations. Voronoi Treemaps are visually-pleasing and efficiently use the available space and with FoamTree you can customize the colors, fonts, borders, shadows and other aspects of FoamTree cells as well as create tens of rollout and pullback effects.
Cube is an open-source system for visualizing time series data, built on MongoDB, Node and D3. If you send Cube timestamped events (with optional structured data), you can easily build realtime visualizations of aggregate metrics. For example, you might use Cube to monitor traffic to your website, counting requests: n Examples/references: Video demo
D3plus is an extension to the D3 library that allows fast and easy creation of data visualizations.
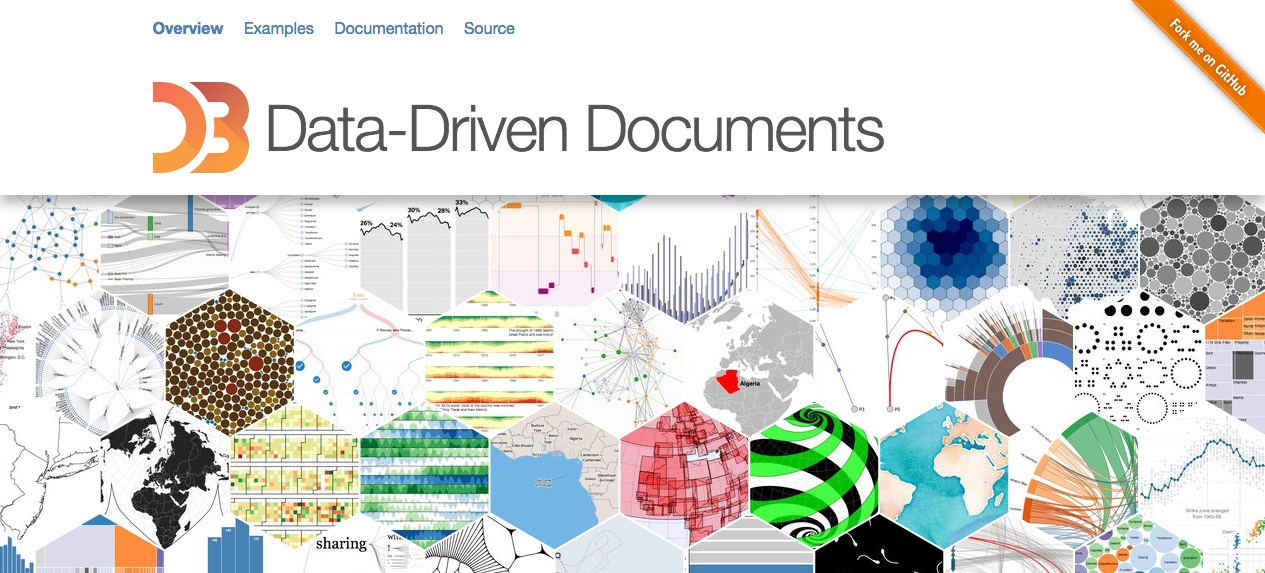
D3 is inarguably the most dominant and important programming library for creating dynamic, interactive visaulisations. Created by Mike Bostock, who previously worked at the New York Times, D3.js is a JavaScript library for manipulating documents based on data. D3 helps you bring data to life using HTML, SVG and CSS. D3’s emphasis on web standards gives you the full capabilities of modern browsers without tying yourself to a proprietary framework, combining powerful visualization components and a data-driven approach to DOM manipulation.
D4 is a friendly charting DSL for D3. The goal of D4 is to allow developers to quickly build data-driven charts with little knowledge of the internals of D3.
D3 in a Box: Package a D3 visualization for easy data editing and deployment. Store your data in a Google Spreadsheet. We serve it up fast! Archive and reuse, We keep your visualization in a container you can share. Deploy anywhere - We host your widget as an HTML5 Web Component.
A library for creating interactive time series graphs based on D3.js.
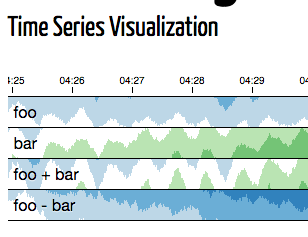
A library for creating interactive time series and horizon graphs based on D3.js
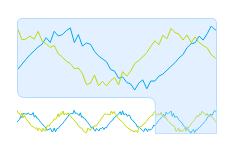
A library for creating fast, dynamic and interactive time series visualizations.
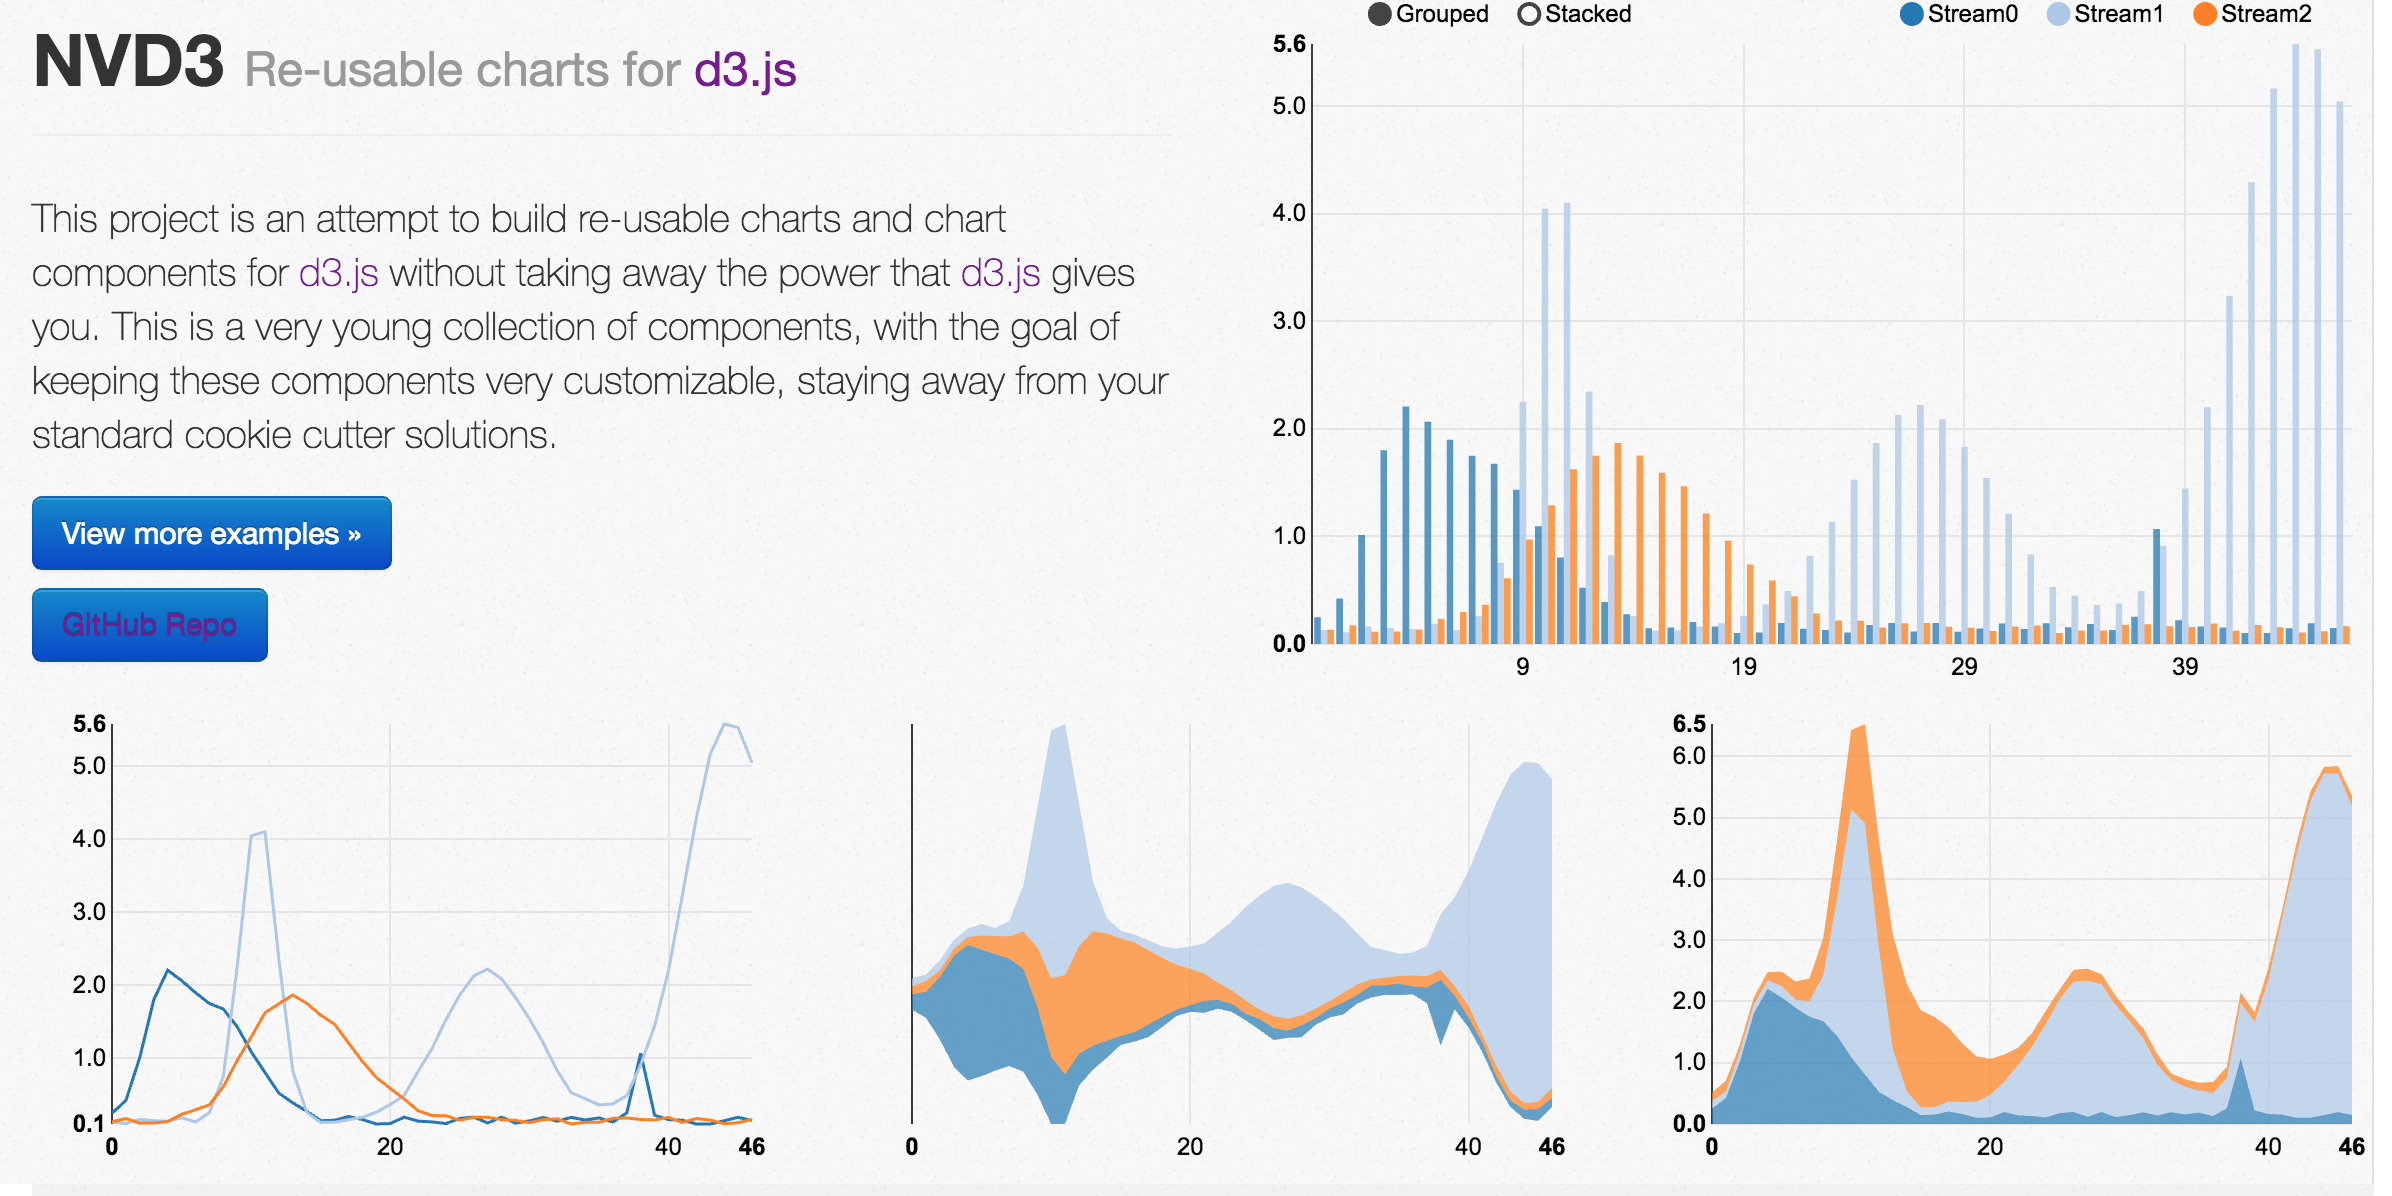
A collection of re-usable charts and chart components for d3.js.
An small, flexible and efficient library to create and manipulate interactive documents based on data.
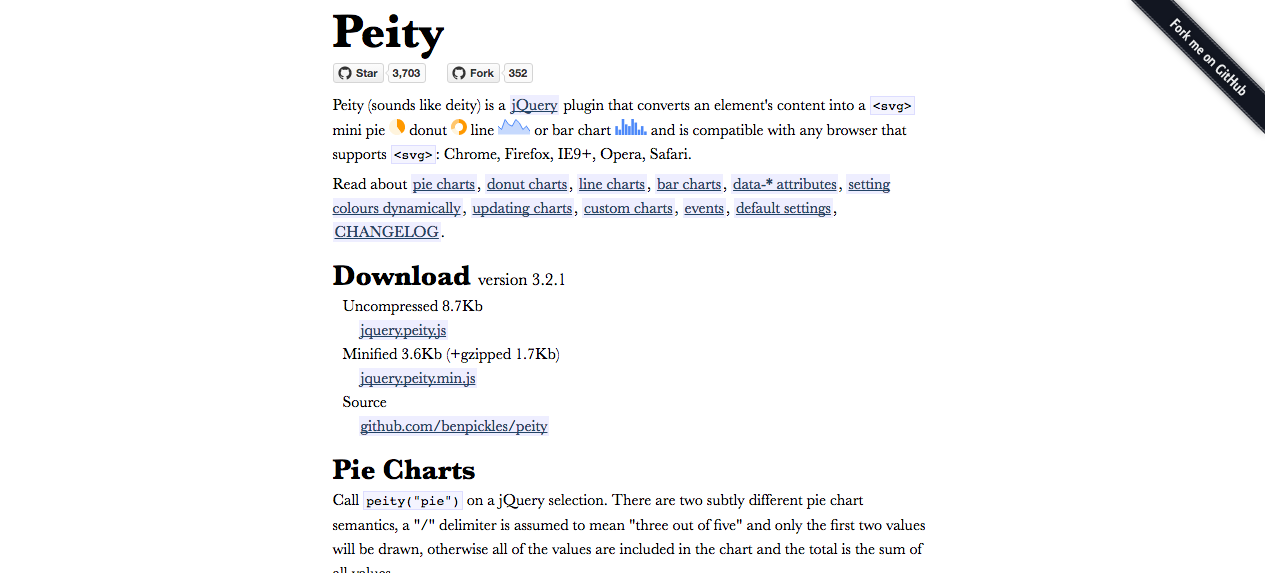
A simple jQuery plugin that converts an element’s content into a simple mini pie, line or bar chart.
A simple data-driven visualization framework based on Data.js and Underscore.js