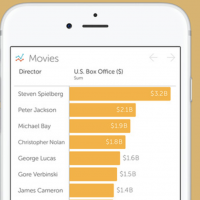
Numerics
Numerics is an iOS app that allows you to create mobile dashboards out of widgets that pull in data from a wide variety of APIs and services for on-the-fly analysis.
Numerics is an iOS app that allows you to create mobile dashboards out of widgets that pull in data from a wide variety of APIs and services for on-the-fly analysis.
See, Touch, Understand. Vizable is a free app by Tableau that turns your data into beautiful, interactive graphs. If you have a tablet, data, and questions, Vizable is for you.

Just download data from Fitbit, Mint, Dropbox, Google Drive, and more - and find out what insights are hiding in that Excel or CSV attachment.
Textal is a free smartphone app that allows you to analyze websites, tweet streams, and documents, as you explore the relationships between words in the text via an intuitive word cloud interface. You can generate graphs and statics, as well as share the data and visualizations in any way you like. n Examples/reference: Gallery
Perspective is an iOS interactive storytelling app that allows you to create immersive data-driven narratives,
Chartistic comes with an assortment of interactive bar charts, line charts, area charts, (sweet as) pie charts that are both great to look at and fun to create.
Create and edit on-the-go.